In order to compare and combine the above-quoted data on the differentiation of the peasantry, we obviously cannot take absolute figures and put them into groups: for that we should require complete data for the whole group of districts and identical methods of classification. We can only compare and juxtapose the relation of the top to the bottom groups (as regards possession of land, animals, implements, etc.). The relationship expressed, for example, in the fact that 10% of the households have 30% of the area under crops, does away with the difference in the absolute figures and is therefore suitable for comparison with every similar relationship in any locality. But to make such a comparison we must single out in the other locality 10% of the households, too, neither more nor less. But the sizes of the groups in the different uyezds and gubernias are not equal. And so, we have to split up these groups so as to take in each locality an equal percentage of households. Let us agree to take 20% of the households for the well-to-do peasants and 50% for the poor, i.e., let us form out of the top groups one of 20% of the households, and out of the bottom groups one of 50%. Let us illustrate this method by an example. Suppose we have five groups of the following proportions, from the bottom to the top: 30%, 25%, 20%, 15% and 10% of the households (S = 100%). To form a bottom group, we take the first group and 4/5 of the second group (30 + (25x4) / 5 = 50%), and to form a top group we take the last group and 2/3 of the penultimate group (10 + (15x2) / 3 = 20%), the percentages for area under crops, animals, implements, etc., being determined, of course, in the same way. That is to say, if the percentages for area under crops corresponding to the above-stated percentages of the households are as follows: 15%, 20%, 20%, 21% and 24% (S = 100%), then our top group, 20% of the households, will account for (24 + (21x2) / 3 = 38%) of the area under crops, while our bottom group, 50% of the households, will account for (15 + (20x4) / 5 = 31%) of the area under crops. Obviously, in splitting up the groups in this manner, we do not change by one iota the actual relationship between the bottom and top strata of the peasantry.[1] This splitting up is necessary, firstly, because in this way, instead of 4—5—6—7 different groups, we get three large groups with clearly defined indices[2]; secondly, because only in this way are data on the differentiation of the peasantry in the most varied localities under the most varied conditions comparable.
To judge the interrelation between the groups we take the following data, the most important on the question of differentiation: 1) number of households; 2) number of persons of both sexes of the peasant population; 3) amount of allotment land; 4) purchased land; 5) rented land; 6) land leased out; 7) total land owned or in use by the group (allotment + purchased + rented - land leased out); 8) area under crops; 9) number of draught animals; 10) total number of animals; 11) number of households employing farm labourers; 12) number of households with employments (singling out as far as possible those forms of “employment” among which work for hire, sale of labour-power predominates); 13) commercial and industrial establishments and 14) improved agricultural implements. The items given in italics (“leasing of land” and “employments”} are of negative significance, since they indicate the decline of the farm, the ruin of the peasant and his conversion into a worker. All the other data are of positive significance, since they indicate the expansion of the farm and the conversion of the peasant into a rural entrepreneur.
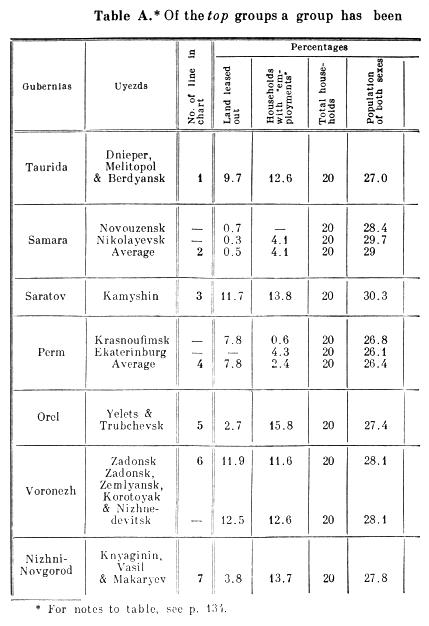
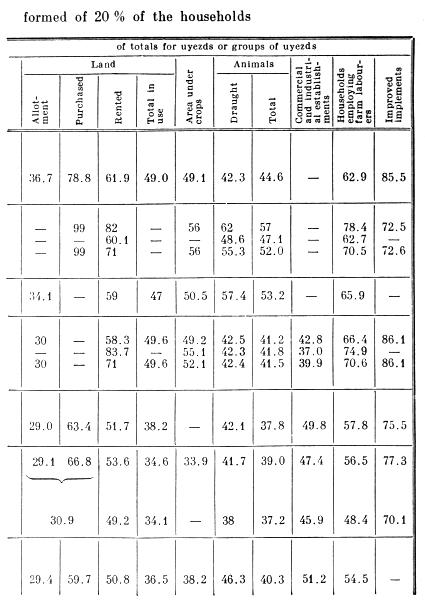
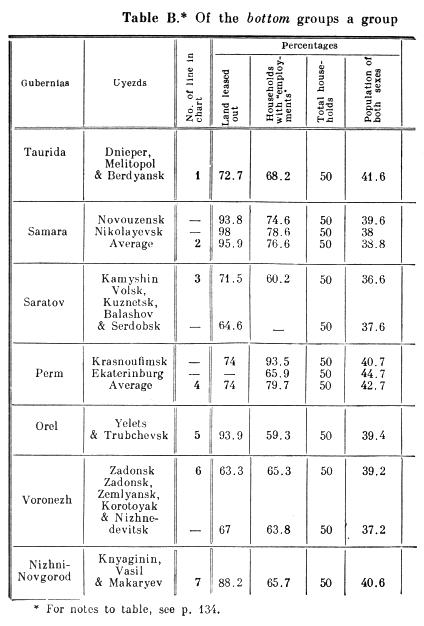
On all these points we compute for each group of farms the percentages of the total for the uyezd or for several uyezds of one gubernia, and then ascertain (by the method we have described) what percentage of the land, area under crops, animals, etc., falls to the 20% of the households of the top groups and to the 50% of the households of the bottom groups.[3]
We give a table drawn up in this manner covering the data for 21 uyezds in 7 gubernias, with a total of 558,570 peasant farms and a population of 3,523,418 persons of both sexes.
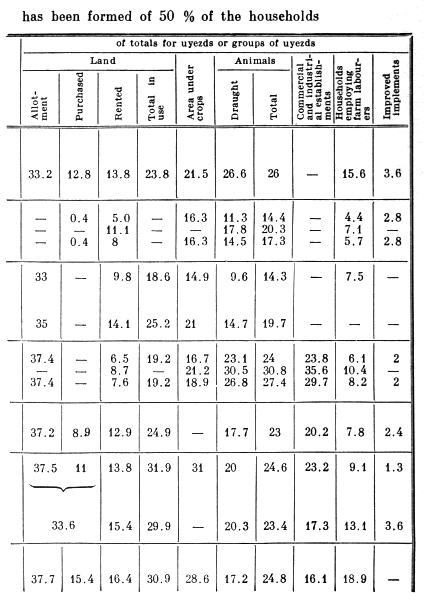
Notes to tables A and B
1. For Taurida Gubernia the returns for land leased out concern only two uyezds: Berdyansk and Dnieper.
2. For the same gubernia the category of improved implements includes mowers and reapers.
3. For the two uyezds of Samara Gubernia instead of the percentage of land leased out the percentage of allotment-leasing non-farming households has been taken.
4. For Orel Gubernia the amount of land leased out (and consequently of the total land in use) has been determined approximately. The same applies to the four uyezds of Voronezh Gubernia.
5. For Orel Gubernia the returns for improved implements exist for only Yelets Uyezd.
6. For Voronezh Gubernia, instead of the number of households with employments we have taken (for three uyezds: Zadonsk, Korotoyak and Nizhnedevitsk) the number of households providing farm labourers.
7. For Voronezh Gubernia returns for improved implements exist for only two uyezds: Zemlyansk and Zadonsk.
8. For Nizhni-Novgorod Gubernia, instead of households engaged in “industries” in general, we have taken the households engaging in outside employments.
9. For some of the uyezds, instead of the number of commercial and industrial establishments, we have had to take the number of households with commercial and industrial establishments.
10. Where the statistical returns give several columns of “employments” we have tried to single out those “employments” which most exactly indicate work for hire, the sale of labour-power.
11. All rented land, as far as possible, has been taken—allotment and non-allotment, arable and meadow land.
12. We would remind the reader that for Novouzensk Uyezd farm-stead peasants and Germans are excluded, for Krasnoufimsk Uyezd only the agricultural part of the uyezd has been taken for Ekaterinburg Uyezd landless peasants and those possessing a share in meadow land alone are excluded, for Trubchevsk Uyezd suburban village communities are excluded, for Knyaginin Uyezd the industrial village of Bolshoye Murashkino is excluded, etc. These exclusions are partly ours, and are partly due to the nature of the material. Obviously, therefore, the differentiation of the peasantry must actually be more pronounced than appears in our table and chart.
To illustrate this combined table and to show clearly the complete similarity, of the relationship of the top to the bottom peasant groups in the most varied localities, we have drawn the following chart on which are plotted the percentages in the table. To the right of the column indicating the percentages of total households, runs a curve showing the positive indices of economic strength (enlargement of holding, increase in the number of animals, etc.), while to the left runs a curve showing the negative indices of economic strength (leasing out of land, sale of labour-power; these columns are shaded). The distance from the top horizontal line of the chart to each continuous curve shows the share of the well-to-do groups in the sum-total of peasant farming, while the distance from the bottom horizontal line to each broken curve shows the share of the poor groups in that sum total. Lastly, to give a clear picture of the general character of the combined data, we have plotted an “average” curve (arrived at by calculating arithmetical averages from the percentages indicated in the chart. To distinguish it from the others, this “average” curve is in red). This “average” curve indicates, so to speak, the typical differentiation of the Russian peasantry today.
Now, in order to sum up the data on differentiation given above (§§ I-VII), let us examine this chart column by column.
The first column to the right of the one indicating the percentages of households shows the proportion of the population belonging to the top and the bottom groups. We see that everywhere the size of the families of the well-to-do peasantry is above the average and that of the poor below the average. We have already spoken of the significance of this fact. Let us add that it would be wrong to take as the unit for all comparisons the individual (as the Narodniks are fond of doing) and not the household, the family. While the expenditure of the well-to-do family grows because of the larger size of the family, the mass of expenditure, on the other hand, in the large-family household diminishes (on buildings, domestic effects, household needs, etc., etc.The economic advantages of large families are particularly stressed by Engelhardt in his Letters From the Countryside,[8] and by Trirogov in his book, The Village Community and the Poll Tax, St. Petersburg, 1882). Therefore, to take the individual as the unit for comparisons, and to take no account of this diminution, means artificially and falsely to identify the condition of the “individual” in the large and in the small families. Incidentally, the chart clearly shows that the well-to-do group of peasants concentrate in their hands a far larger share of agricultural production than would follow from a calculation per head of population.
The next column refers to allotment land. In its distribution we see the greatest degree of equality, as should be the case by virtue of the legal status of allotment land. But even here the process of the poor being ousted by the well-to-do peasants is beginning: everywhere we find that the top groups hold a somewhat larger share of the allotment land than the share they represent in the population, while the bottom groups hold a somewhat smaller one. The “village community” tends to serve the interests of the peasant bourgeoisie. Compared, however, with the actual land tenure the inequality in the distribution of allotment land is still quite insignificant. The distribution of allotment land does not (as is clearly evident from the chart) give any idea of the actual distribution of land and farm property.[4]
Then comes the column for purchased land. In all cases this land is concentrated in the hands of the well-to-do: one fifth of the households have about 6 or 7 tenths of all peasant owned purchased land, whereas the poor peasants, constituting half the households, account for a maximum of 15%! One can judge, therefore, the significance of the “Narodnik” fuss about enabling the “peasantry” to buy as much land as possible and as cheaply as possible.
The next column is that for rented land. Here too we see everywhere the concentration of the land in the hands of the well-to-do (one-fifth of the households account for 5 to 8 tenths of the total rented land) who, moreover, rent land at cheaper rates, as we have seen above. This grabbing of rentable land by the peasant bourgeoisie clearly demonstrates that “peasant renting” carries an industrial character (the purchase of land for the purpose of selling the product.)[5] In saying this, however, we do not at all deny the fact of land renting being due to want. On the contrary, the chart shows the entirely different character of renting by the poor, who cling to the land (half the households account for 1 to 2 tenths of the total rented land). There are peasants and peasants.
The contradictory significance of land renting in “peasant farming” stands out particularly vividly when we compare the column on land renting with that on the leasing out of land (first column to the left, i.e., among the negative indices). Here we see the very opposite: the principal lessors of land are the bottom groups (half the households account for 7 to 8 tenths of the land leased), who strive to get rid of their allotments, which pass (despite legal prohibitions and restrictions) into the hands of employer farmers. Thus, when we are told that the “peasantry” rent land and that the “peasantry” lease out their land, we know that the first applies mainly to the peasant bourgeoisie and the second to the peasant proletariat.
The relation of purchased, rented and leased land to the allotment determines also the actual land held by the groups (5th column to the right). In all cases we see that the actual distribution of the total land at the disposal of the peasants has nothing in common with the “equality” of the allotments. Of the households 20% account for 35% to 50% of the total land, while 50% account for 20% to 30%. In the distribution of area under crops (next column) the ousting of the bottom group by the top stands out in still greater relief, probably because the poor peasantry are often unable to make economic use of their land and abandon it. Both columns (total land held and area under crops) show that the purchase and the renting of land lead to a diminution of the share of the bottom groups in the general system of economy, i.e., to their being ousted by the well-to-do minority. The latter now play a dominant role in the peasant economy, concentrating in their hands almost as much of the area under crops as do all the rest of the peasants put together.
The next two columns show the distribution of draught and other animals among the peasantry. The percentages of animals differ very slightly from those of area under crops; nor could it be otherwise, for the number of draught animals (and also of other animals) determines the area under crops, and in its turn is determined by it.
The next column shows the share of the various groups of the peasantry in the total number of commercial and industrial establishments. One-fifth of the households (the well-to-do group) concentrate in their hands about half of these establishments, while half the households, the poor, account for about 1/5,[6] that is to say, the “industries” that express the conversion of the peasantry into a bourgeoisie are concentrated mainly in the hands of the most affluent cultivators. The well-to-do peasants, consequently, invest capital in agriculture (purchase and renting of land, hire of workers, improvement of implements, etc.), industrial establishments, commerce, and usury: merchant’s and entrepreneur capital are closely connected, and surrounding conditions determine which of these forms of capital becomes predominant.
The data on households with “employments” (the first column to the left, among the negative indices) also characterise the “industries,” which are, however, of opposite significance, and mark the conversion of the peasant into a proletarian. These “industries” are concentrated in the hands of the poor (they constitute 50% of the households and account for 60% to 90% of the total households with employments), whereas the part played in them by the well-to-do groups is insignificant (it must not be forgotten that we have not been able to draw an exact line of demarcation between masters and workers in this category of “industrialists” either). One has only to compare the data on “employments” with the data on “commercial and industrial establishments” to see how utterly opposite are these two types of “industries,” and to realise what incredible confusion is created by the customary lumping together of these types.
Households employing farm labourers are in all cases concentrated in the group of well-to-do peasants (20% of the households account for 5 to 7 tenths of the total number of farms employing labourers), who (despite their having larger families) cannot exist without a class of agricultural labourers to “supplement” them. Here we have a striking confirmation of the proposition expressed above: that to compare the number of farms employing labourers with the total number of peasant “farms” (including the “farms” of the agricultural labourers) is absurd. It is much more correct to compare the number of farms employing labourers with one-fifth of the peasant households, for the well-to-do minority account for about 3/5 , or even 2/3 , of the total of such farms. The entrepreneur hiring of labourers from among the peasantry far exceeds hiring from necessity, that is, because of a shortage of workers in the family: the poor and small-family peasants, constituting 50% of the households, account for only about 1/10 of the total number of farms employing labourers (here too, incidentally, shopkeepers, industrialists, etc., who do not hire workers on account of necessity, are included among the poor).
The last column, showing the distribution of improved implements, we could have headed “progressive trends in peasant farming,” following the example of Mr. V. V. The “fairest” distribution of these implements is that in Novouzensk Uyezd, Samara Gubernia, where the well-to-do households, constituting one-fifth of the total, have only 73 out of 100 implements, whereas the poor, constituting half the households, have as many as three out of a hundred.
Let us now compare the degree of peasant differentiation in the different localities. In the chart two types of localities stand out very clear]y in this regard: in Taurida, Samara, Saratov and Perm gubernias the differentiation of the agricultural peasantry is markedly more intense than in Orel, Voronezh and Nizhni-Novgorod gubernias. The curves of the first four gubernias in the run below the red average line, while those of the last three gubernias run above the average, i.e., show a smaller concentration of farming in the hands of the well-to-do minority. The localities of the first type are the most land-abundant and strictly agricultural (in Perm Gubernia the agricultural parts of the uyezds have been singled out), with extensive farming. With farming of this character the differentiation of the agricultural peasantry is easily noted and therefore clearly visible. Conversely, in the localities of the second type we see, on the one hand, a development of commercial agriculture such as is not noted in our data; for example, the sowing of hemp in Orel Gubernia. On the other hand, we see the tremendous significance of “industries,” both in the sense of work for hire (Zadonsk Uyezd, Voronezh Gubernia) and in the sense of non-agricultural occupations (Nizhni-Novgorod Gubernia). The significance of both these circumstances for the question of the differentiation of the agricultural peasantry is enormous. Of the former (the different forms of commercial agriculture and agricultural progress in the different localities) we have already spoken. The significance of the latter (the role of the “industries”} is no less obvious. If in a given locality the bulk of the peasants are allotment-holding farm labourers, day labourers or wage-workers in industries, the differentiation of the agricultural peasantry will, of course, be marked very feebly.[7] But to get a proper idea of the matter, these typical representatives of the rural proletariat must be compared with typical representatives of the peasant bourgeoisie. The allotment-holding Voronezh day labourer who goes south in search of odd jobs must be compared with the Taurida peasant who cultivates huge tracts of land. The Kaluga, Nizhni-Novgorod and Yaroslavl carpenter must be compared with the Yaroslavl or Moscow vegetable grower or peasant who keeps cows to sell the milk, etc. Similarly, if the bulk of the peasants in a locality are engaged in the manufacturing industries, their allotments providing them with only a small part of their means of livelihood, the data on the differentiation of the agricultural peasantry must be supplemented with data on the differentiation of those who engage in industries. In Chapter 5 we shall deal with this latter question; at the moment we are concerned only with the differentiation of the typically agricultural peasantry.
[1] This method involves a slight error, as a consequence of which the differentiation appears to be less than it really is. Namely: to the top group are added average, and not the top members of the next group; to the bottom group are added average, and not the bottom members of the next group. Clearly the error becomes greater as the groups become larger and the number of groups smaller.—Lenin
[2] In the next section we shall see that the proportions of the groups we have taken come very close to those of the groups of the Russian peasantry as a whole, divided according to the number of horses per household.—Lenin
[3] We beg the reader not to forget that now we are dealing not with absolute figures, but with relationships between the top and the bottom strata of the peasantry. Therefore, for example, we now take the number of households employing farm labourers (or with “employments”} as percentages, not of the number of households in the given group, but of the total number of households employing farm labourers (or with “employments”} in the uyezd. In other words, what we now ascertain is not the extent to which each group employs wage-labour (or resorts to the sale of labour-power) but merely the relationships between the top and bottom groups as to the employment of wage-labour (or to participation in “employments,” in the sale of labour-power).—Lenin
[4] A single glance at the chart is sufficient to see how useless is classification according to allotment for a study of the differentiation of the peasantry.—Lenin
[5] Very curious in Mr. Karyshev’s book on the subject of rentings is the Conclusion (Chapter VI). After all his assertions about the absence of an industrial character in peasant renting, assertions devoid of foundation and contradicting Zemstvo statistics, Mr. Karyshev advances a “theory of rent” (borrowed from W. Roscher, etc ), in other words, serves up with a scientific sauce the desiderata of West-European capitalist farmers: “long leases” (“what is needed is . . . ‘ efficient’ use of the land by . . . the peasant,” p. 371) and moderate rents that leave the tenant enough to cover wages, interest and the repayment of invested capital, and employer’s profit (373). And Mr. Karyshev is not in the least disturbed by the fact that this sort of theory” appears side by side with the usual Narodnik recipe: “avert” (398). In order to “avert” capitalist farming Mr. Karyshev advances the “theory” of capitalist farming! This sort of “conclusion” naturally crowned the basic contradiction in the book by Mr. Karyshev who, on the one hand, shares all the Narodnik prejudices and wholeheartedly sympathises with such classical theoreticians of the petty bourgeoisie as Sismondi (see Karyshev, Perpetual Hereditary Land Hire on the European Continent, Moscow, 1885), but on the other hand, cannot avoid the admission that land renting gives an “impetus” (p. 396) to the differentiation of the peasantry, that the “better-off strata” oust the poorer, and that the development of agrarian relations leads precisely to agricultural wage-labour (p. 397)—Lenin
[6] Even this figure (about 1/5 of all the establishments) is, of course, an exaggeration, for the category of non-sowing and horseless and one-horse peasants lumps agricultural labourers, unskilled labourers, etc., together with non-cultivators (shopkeepers, artisans, etc.).—Lenin
[7] It is quite possible that in the central black-earth gubernias, like Orel, Voronezh and others, the differentiation of the peasantry is indeed much feebler, because of land-poverty, heavy taxation and the wide prevalence of the labour-service system: all these are circumstances retarding differentiation.—Lenin
[8] See A. N. Engelhardt, From the Countryside. 11 Letters. 1872-1882, St. Petersburg, 1885. In 1937 this book was republished by the Publishing House for Social and Economic Literature, Moscow.
| VIII. Review Of Zemstvo Statistics For Other Gubernias | | | X. Summary Of Zemstvo Statistics And Army-Horse Census Returns |
| Document Index | ||
| < Backwards | Forwards > | |||||
| Works Index | | | Volume 3 | | | Collected Works | | | L.I.A. Index |