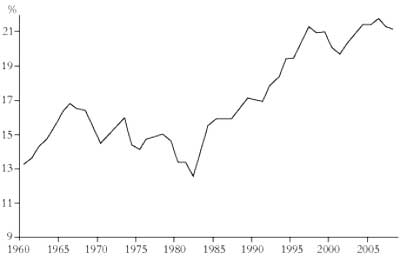
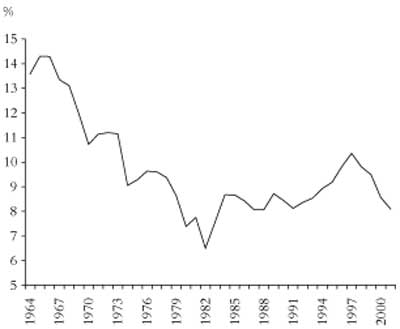
Figure 1: Husson’s figures for the US rate of profit
Source: Husson, 2009
From International Socialism (2nd series), No.125, Winter 2010.
Copyright © International Socialism.
Downloaded with thanks from the International Socialism Website.
Marked up by Einde O’Callaghan for the Marxists’ Internet Archive.
Michel Husson has criticised a number of Marxist economists, including myself, in the most stringent manner. [1] He writes that:
The crisis has given rise in recent months to a series of contributions characterised by a counterproductive and discouraging dogmatism ... What these contributions have in common are references to the orthodox interpretation of the law of the tendency of the rate of profit to fall. [2]
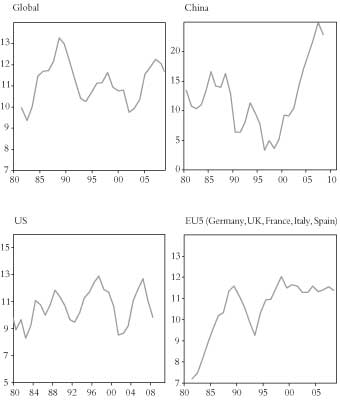
This, he claims, ignores the elementary fact that “there has been a very clear tendency for the rate of profit to rise in the principal capitalist countries. This evolution is sufficiently pronounced that one cannot expect it to be affected significantly by more or less appropriate correctives.” He then provides a graph based on figures provided by the European Union for the US, Europe and the G8 that purport to justify his argument.
But there are big problems with coming to terms with these figures. First, he does not either provide information as to where the European Union got its figures from or explain in detail the methodology used to construct the rate of profit from them (all he says is that they “relate the net excess from exploitation to the stock of capital”). Without such information it is impossible for those of us accused of “dogmatism” to subject his argument to scientific scrutiny.
|
Figure 1: Husson’s figures for the US rate of profit |
|
Secondly, his graphs differ very markedly from numerous other attempts to calculate the path of the rate of profit. This is most clearly the case with the US. Husson claims that in the decade 1998-2008 the rate of profit there not only recovered from a fall in the years after 1968-82 of about a quarter but rose to about 30 percent higher than the pre-1973 level. [3]
By contrast Robert Brenner, Fred Moseley, Simon Mohun, Alan Freeman and Andrew Kliman have all provided figures which, although differing to some degree with each other, show a pattern which is very different from the one Michel Husson portrays. [4] On the one hand they show a bigger decline up to 1982 than does Husson; on the other they show the recovery since to have been much more limited than Husson suggests, and not even reaching, let alone going 30 percent beyond, the figure for the late 1960s. Moseley, who shows the biggest recovery of profit rates in recent years, provides a pattern that nowhere approaches Husson’s, while Brenner, Mohun, Freeman and Kliman all show recent profitability to have been substantially lower than during the 1960s. These figures are all based upon checkable statistics provided by the US Bureau of Economic Affairs in its NIPA tables. Arnaud Sylvain only provides figures up to 2000, but his graph certainly does not show the massive rise above the figures for the 1960s which Husson claims – rather it shows their peak in the late 1990s as being only about the level of 1973 and well below the level of the mid to late 1960s. [5] Gérard Duménil and Dominique Lévy’s figures up to 1997 are similarly very different from Husson’s. [6] Figures by Goldman Sachs only start in the 1980s and so do not show the decline in profits from the late 1960s. But the pattern of the recovery of US profits is very different from Husson’s with the level in 1997 and 2007 only about 10 percent higher than in 1988. [7]
The same contradictions with Husson’s figures are to be found with calculations for other countries. Brenner and Sylvain show a long-term fall in the rate of profit for Japan; as do Arthur Alexander [8], and Fumio Hayashi and Edward C. Prescott. [9] Mehmet Ufuk Tutan has carried out a meticulous study of profit rates for Germany. It only goes up to 1987 but shows a much less marked recovery than would be implied by Husson’s graph for the four biggest European economies. [10] I have come across three studies of profit rates for China. One shows a sharp drop of more than a third between 1978 and 2000 [11]; the second shows an even sharper drop of around 40 percent from the 1980s until 2003 [12]; the third shows a fall for manufacturing until 1999 but a considerable rise after that. [13]
All these figures, it should be noted, are subject to enormous qualifications on at least two fronts.
|
Figure 2: Moseley’s figures for the US rate of profit |
 |
First there are problems deciding on how to measure capital investment – and then on finding the appropriate figures. Firms calculate the profitability of any investment by adding together the initial capital outlay on structures and equipment, adding the annual expenditure on raw materials, components and wages, and then dividing the total by their net profits, ie they divide what they laid out over a number of years by the profits made over those years. So with “conventional accounting procedures ... the values of the capital stock and of capital consumption are measured at historic cost”. [14]
But aggregating the different investments made at different times in a particular period is a necessarily complicated procedure, and most attempts to measure national rates of profit use a different procedure – that of current cost accounting. The profit made in a given year is measured against the market value (i.e. the replacement cost) of the structures and equipment used. This necessarily leads to a distortion in the figures since any increase in productivity since the investment was made will mean that its current market value is less than what was laid out on it: the rate of profit will appear higher than it actually was. The greater the speed of technological innovation the greater the discrepancy will be. This is very important in recent years given the rapid increase in computer-related productivity. [15] One would expect current cost calculations of the rate of profit to show recent profits relatively higher compared with those previously.
|
Figure 3: Brenner’s figures for the US non-financial profit rate |
 |
A second sort of distortion can affect the figures for historic cost calculations of the rate of profit in periods of rising prices of stocks of goods held by companies. Profitability can be magnified by the apparent increase in the value of these holdings as a result of inflation. [16]
Andrew Kliman has attempted to provide figures that eliminate both sorts of distortion, using historic cost calculations that attempt to remove the effect of inflation. [17] The overall pattern of his graphs is not completely dissimilar to that of Brenner, Mohun and Moseley – except that they show a much smaller recovery of profitability from the low point of the early 1980s.
|
Figure 4: Kliman’s figures for the US rate of profit |
 |
A third distortion in profitability figures can come from asset bubbles. These lead to firms asserting that their values have risen by more than any increase in real production (this is shown clearly in the US Flow of Funds accounts) – and in the case of financial transactions the increase can be recorded as part of the net increase in national output. Since profits in the national economy are usually calculated by deducting wage costs from the net national product its increase leads to profits seeming to increase more than they actually have.
The shock of the financial crash of the last two years is now leading some bourgeois economic commentators to recognise that there were “fictional profits” – and with them “fictional economic growth” – in the mid-2000s, if not earlier. Most calculations of profitability try to circumvent this problem by restricting themselves to non-financial corporations (or sometimes the non-financial business sector). But there are questions as to whether this completely eliminates the distortion since non-financial corporations like General Electric (the US’s biggest manufacturing corporation), Ford and General Motors became increasingly dependent on financial operations from the 1990s onwards.
|
Figure 5: Mohun’s figures for the US rate of profit |
 |
The Financial Times has reported that Andrew Smithers, the economic analyst, “has argued for some time that this is seriously distorted by inflation of asset values. He calculates that in 2007 changes in real estate values alone added a daunting $1,000bn-plus to non-financial corporate balance sheets”. [18] Smithers calculates that asset appreciation of this sort “accounted for a rather staggering 22 percent of total earnings from non-financial corporations” in the last decade. [19] General Electric was fined several million dollars in August for falsely inflating its profit figures.
There is every reason to think that Husson’s figures will reflect all these distortions. The European site he refers to certainly estimates the value of investment undertaken by firms in terms of its replacement cost not its current cost. It also seems likely that the figures are for the whole economy including all of the bubble-inflated apparent profits for the financial sector. But without a detailed account of methodology and sources it is difficult to be more precise.
It is not only Husson’s figures that are questionable so is his attempt to explain them in Marxist terms. He writes of Marx’s “tendency of the rate of profit to fall”:
There is no a priori reason to think that the tendency systematically overcomes the counter-tendency. The productivity of labour is able to compensate, in a perfectly symmetrical manner, for rises in real wages and the increase in physical capital.
The accumulation of means of production does not have to mean, he insists, an increase in the organic composition of capital:
The increase in the productivity of labour permits a reduction in the costs of machines. And this counter-tendency can compensate for the increase in the number of machines so that the evolution of the organic composition is indeterminate.
Under such circumstances an increase in the rate of exploitation of each worker can lead to a rising rate of profit. And this, he argues from his figures, is what has been happening over the last quarter of a century: “The numerator and denominator of the rate of profit can remain constant, and, consequently, the rate of profit.”
There is, however, an important gap in his reasoning. He ignores an important point which has been made by various Marxists in controversies over the rate of profit in the last 40 years. [20] The controversy was aroused by the theorem of the Japanese Marxist Okishio who argued that because capitalists would not introduce new technology unless it raised the rate of profit, rising capital investment could not reduce the rate of profit. Its effect would, in fact, be to raise productivity and so reduce the cost of new investment producing a general rise in the rate of profit. The only thing that could then reduce profitability would be a fall in the rate of exploitation (i.e. a rise in the share of output going to workers).
|
Figure 6: Freeman’s figures for the US rate of profit |
 |
There is a simple and conclusive counter-argument which has been put in different ways by Robin Murray [21], Ben Fine and Lawrence Harris [22], Guglielmo Carchedi [23], Alan Freeman, Andrew Kliman [24] and myself. [25] It is that the effect of increased productivity in reducing the cost of future investments does not help individual capitalists profit from existing investment.
As the saying goes, “You cannot build the houses of today with the bricks of tomorrow.” The fact that new machines will cost less to buy in a year or two’s time does not somehow reduce the amount you have already spent on your existing ones. In fact, the more rapidly technological innovation takes place and productivity rises the more rapidly the machines suffer from “moral depreciation” and become obsolete. There is increased pressure not reduced pressure on profitability as a result.
|
Figure 7: Sylvain’s figures for the rate of profit in various countries |
 |
There is only one way this can work out in a way that counteracts the downward pressure on profit rates. That is if the cost of existing investments can somehow how be removed from the books (if capitals can be devalorised). But the individual capitalist cannot simply shrug off what he has spent already. If he does so he faces a reduction in his profitability every way he looks at it.
As I put it in my latest book, Zombie Capitalism:
Investment ... takes place at one point in time. The cheapening of further investment as a result of improved production techniques occurs at a later point in time. The two things are not simultaneous ... When capitalists measure their rates of profit they are comparing the surplus value they get from running plant and machinery with what they spent on acquiring it at some point in the past—not what it would cost to replace it today ... [The rate of profit] necessarily implies a comparison of current surplus value with the prior capitalist investment from which it flows. The very notion of ‘self-expanding values’ is incoherent without it. [26]
This means there is only one way in which the falling cost of new investment can overcome problems of profitability. It is if some capitals bear the losses due to devalorisation and are driven out of business while others benefit by buying up their structures, equipment and raw materials at less than their value. The crisis, by creating conditions under which some capitals cannibalise others, provides the conditions under which falling costs of new investment can serve to counter the long-term downward pressure on profit rates.
However, an important empirical fact about the economic crises of the last 40 years has been that there have been relatively low levels of business failures. The concentration and centralisation of capital means that the biggest firms are able to protect their less profitable divisions from going bust – a point already made by Preobrazhensky in 1931. [27] Other capitalists’ fear of the damage which would follow if the really big firms themselves simply went bust has led in each crisis in recent decades to states stepping in to prevent that happening – what mainstream economic commentators now call the “too big to fail” problem. A study of bankruptcies in the US concludes that they were very rare indeed until the 1990s. There were more in the short crisis of 2000-2 (Enron and WorldCom were the best known) but the turn to state bailouts since the collapse of Lehman Brothers – including the massive involvement of states in preventing a simple collapse of General Motors and Chrysler – shows the limits on the devalorisation of capital through crisis.
|
Figure 8: Duménil and Lévy’s figures for the US business profit rate |
 |
It is this which explains the dilemma faced by neoliberal economists in the current crisis. A pure Hayekian or neoclassical position would mean allowing many of the giant firms to go bust so as to provide a lease of life to the rest. But the reality is that the concentration and centralisation of capital has reached a point where the different elements of the system are so intertangled that unprofitable firms going bust can damage, rather than help, the remaining profitable ones.
Such reasoning enables us to see that the roots of the crisis do in fact lie in the downward pressure on profitability since the end of the 1960s. The attempts to deal with this have included all the means referred to by Husson – attacks on wages, the social wage, working conditions and so forth – that increase the rate of exploitation. A variety of different sources show an increase in the “share of capital” as opposed to wages for all the major capitalist countries. But in the absence of massive bankruptcies of the giant firms this has not been enough to restore the rate of profit to its old level. The result has been a long-term slowdown in the rate of productive accumulation even when the rapid accumulation taking place in China is taken into account.
In passing, it should be said that this downward trend in accumulation has one side-effect – the reduced tempo of accumulation can, at least at times, reduce the upward pressure on the organic composition of capital. [28]
But the most important effect of decreased accumulation at a time of increasing rate of exploitation is to open up a gap between the capacity of the system to produce goods and the capacity of the market to absorb them. This “overproduction” is not a result of “under-consumption” as such but of the failure of accumulation to take place on the scale necessary to replace lost consumer demand by an increased demand for investment goods.
The expansion of finance has taken place against this background. On the one side it has constituted an attempt by capitalists to get rates of profit higher than they could get from productive investment. This is a procedure that can work for some individual capitalists but not for the system as a whole since, at the end of the day, surplus value comes from productive investment. On the other side it has amounted to workers and members of the middle class being granted loans to buy things which created a short-term increased demand for the goods that could not have been sold otherwise. This “privatised Keynesianism” was positively encouraged by Alan Greenspan as head of the US Federal Reserve in the aftermath of the collapse of the telecoms and dotcom bubble of the late 1990s and the panic at the time of 9/11. But this too could not work beyond a certain point because workers could only have afforded interest payments on the loans sufficient to provide a continuing high level of profits to the finance sector if wages had been raised – which would then have reduced the rate of profit through the system as a whole. As even bourgeois economic commentators like Martin Wolf have recognised, the loans provided the means by which an important section of the US population became “the consumer of last resort” for the rest of the world system – and especially for Germany, China and, via Chinese demand, for Japan, the rest of East Asia and Latin America.
|
Figure 9: Goldman Sach’s figures for yield on physical capital |
 |
The crisis can then be seen as a product of the “law of the tendency of the rate of profit to fall and its countervailing tendencies” – providing the counter-tendencies are seen as limited in their effects, raising the rate of profit from the very low level of the early 1980s but not sufficiently to boost accumulation on the scale needed to absorb everything produced by the system.
|
Figure 10: Tutan’s calculation of the German non-residential rate of profit |
 |
This resolves a mystery in Husson’s picture – as to why his supposedly very high level of profit rates (higher than in the long boom or the “glorious 30 years”) has not led to a level of productive investment sufficient to pull the whole global economy forward. Instead for 30 years we have had spells of accumulation in particular parts of the world system for a number of years at a time (sometimes very sharp spells as in Brazil in the late 1970s, China in the last decade or the US in the mid-1990s), but not a sustained global boom. His explanation seems to be that there are political forces preventing the system undertaking the Keynesian measures that would be good for it and instead leading to a diversion of accumulated money capital from productive investment into finance. It makes more sense to see the flow of money capital into finance as a response to productive profit rates that are deemed to be too low – something which is confirmed by all the calculations of profit rates except for the ones Husson supplies.
It should be added that Husson’s own figures leave another question unanswered: what happens to the money capital that goes into finance? For only a portion of the money capital that flows into finance can stay there since finance (by definition) is not mainly concerned with converting money capital into commodities: some goes on building financial offices and on salaries but most flows back into the rest of the system. The financial system is a network of pipes connecting the different parts of the system that do convert money capital into commodities – or at best a sink which can only hold a certain amount of money capital before overflowing. The housing boom will have converted some of the money capital into commodities but not as much as might be thought, since most of it was absorbed by rising house prices, not by rising house construction (this was particularly clear in Britain, where house prices quadrupled in 12 years while housing construction remained at a historically low figure). In fact, the figures suggest that, in the US at least, it was only in the mid-2000s that finance did not eventually flow back into productive investment. In the mid to late 1990s there was net borrowing by industrial corporations. The problem was that even in this period capital globally did not feel confident enough about profitability to undertake investment on a scale necessary to produce a sustained boom.
1. This paper was written for a recent conference in Amsterdam organised by the Fourth International.
2. Husson, 2009.
3. The figures I give here are based on the graph, since he does not provide the data.
4. These graphs, and the others cited, are scattered throughout the article.
5. Sylvain, 2001.
6. Duménil and Lévy 2002.
7. See Choonara, 2009.
8. Alexander, 1998.
9. Hayashi and Prescott, 2001.
10. Tutan, 2008.
11. O’Hara, 2006.
12. Felipe, Lavina and Fan, 2008.
13. Yu and Feng, 2006.
14. Bank of England Quarterly Bulletin, 1975.
15. See, for instance, Tevlin and Whelan, 2003.
16. Bank of England Quarterly Bulletin, 1975.
17. He does so using normal mainstream inflation figures and his own approach based on the monetary equivalent of labour time (MELT).
18. Jackson, Financial Times, 26 November 2008.
19. Jackson, Financial Times, 30 March 2009.
20. In English, the controversies first developed in the Bulletin of the Conference of Socialist Economists in the early 1970s, with contributions on different sides from Andrew Glyn, Robin Murray, Sue Himmelweit, Bob Rowthorn, Philip Armstrong, Ben Fine and others.
21. Murray, 1973.
22. Fine and Harris, 1979.
23. Carchedi, 1991.
24. Kliman, 2007.
25. Harman, 1984, pp.20-34; Harman, 2009, pp.68-75.
26. Harman 2009, pp.74-75. The first version of this argument I have come across was that put by Robin Murray, using a corn model of production, in the Bulletin of the Conference of Socialist Economists: Murray, 1973.
27. Preobrazhensky, 1985, p.137.
28. Figures for capital-output ratios and for capital-labour ratios suggest this has been the case at various times since the mid-1970s.
Alexander, Arthur, 1998, Japan in the context of Asia, SAIS policy forum series John Hopkins University.
Carchedi, Guglielmo, 1979, Frontiers of Political Economy (Verso).
Choonara, Joseph, 2009, A Note on Goldman Sachs and the Rate of Profit, International Socialism 124 (Autumn 2009), www.isj.org.uk/?id=588.
Daly, Kevin, and Ben Broadbent, 2009, The Savings Glut, the Return on Capital and the Rise in Risk Aversion, Global Economics Paper No.185, Goldman Sachs Global Economics, Commodities and Strategy Research.
Duménil, Gérard, and Dominique Lévy, 2002, The Profit Rate: Where and How Much Did it Fall? Did It Recover?, Review of Radical Political Economy 34, www.jourdan.ens.fr/levy/dle2002f.pdf.
Felipe, Jesus, Edith Lavina, and Emma Xiaoqin Fan, 2008, Diverging Patterns of Profitability, Investment and Growth in China and India during 1980-2003, World Development, volume 36, number 5.
Fine, Ben, and Lawrence Harris, 1979, Rereading Capital (Macmillan).
Freeman, Alan, 2009, What Makes the US Rate of Profit Fall, unpublished paper, http://mpra.ub.uni-muenchen.de/14147/1/MPRA_paper_14147.pdf.
Harman, Chris, 1984, Explaining the Crisis (Bookmarks).
Harman, Chris, 2009, Zombie Capitalism (Bookmarks).
Hayashi, Fumio and Edward C. Prescott, 2001, The 1990s in Japan: A Lost Decade, www.esri.go.jp/jp/prj21/forum04/pdf/summary4.pdf.
Husson, Michel, 2009, Le Dogmatisme n’est Pas Marxism, NPA website, http://bit.ly/husson-dogmatism.
Jackson, Tony, 2008, Recession Flames Fanned by Debt-Capex Combination, Financial Times, 26 November 2008.
Jackson, Tony, 2009, Maybe Equities Rally, but My Money Stays Under the Mattress, Financial Times, 30 March 2009.
Kliman, Andrew, 2007, Reclaiming Marx’s Capital (Lexington Books).
Kliman, Andrew, 2009, The Persistent Fall in Profitability Underlying the Current Crisis: New Temporalist Evidence (second draft), http://akliman.squarespace.com/persistent-fall.
O’Hara, Phillip Anthony, 2006, A Chinese Social Structure of Accumulation for Capitalist Long-Wave Upswing?, Review of Radical Political Economics, volume 38, number 3, http://hussonet.free.fr/rrpe397.pdf.
Mohun, Simon, 2006, Distributive Shares in the US Economy, 1964-2001, Cambridge Journal of Economics, volume 30, number 3.
Moseley, Fred, 2007, Is the US Economy Heading for a Hard Landing?, www.mtholyoke.edu/courses/fmoseley/HARDLANDING.doc.
Murray, Robin, 1973, Productivity, Organic Composition, and the Falling Rate of Profit, Bulletin of the Conference of Socialist Economists, Spring 1973.
Preobrazhensky, Evgeny, 1985 (1931), The Decline of Capitalism (ME Sharpe).
Sylvain, Arnaud, 2001, Rentabilité et Profitabilité du Capital: le Cas de Six Pays Industrialisés, Économie et Statistique, no.341-2, www.insee.fr/fr/ffc/docs_ffc/ES341G.pdf.
Tevlin, Stacey, and Karl Whelan, 2003, Explaining the Investment Boom of the 1990s, Journal of Money, Credit and Banking, volume 35, number 1, www.federalreserve.gov/pubs/feds/2000/200011/200011pap.pdf.
Tutan, Mehmet Ufuk, 2008, The Falling Rate of Profits in West Germany (VDM Verlag Dr Mueller eK).
Yu, Zhang, and Zhao Feng, 2006, The Rate of Surplus Value, the Composition of Capital, and the Rate of Profit in the Chinese Manufacturing Industry: 1978-2005. Paper presented at the Second Annual Conference of the International Forum on the Comparative Political Economy of Globalization, 1-3 September 2006, Renmin University of China, Beijing, China.
Last updated on 7 May 2021